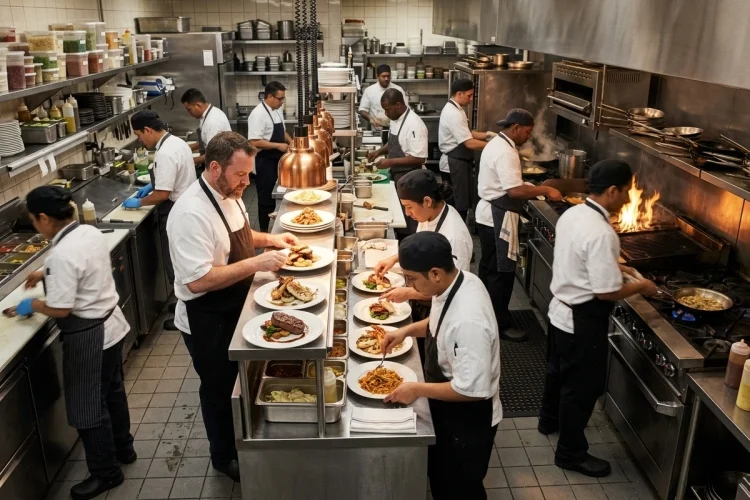
The biggest kitchen problems rarely happen when average demand is average.
They happen when forty tickets arrive together, half the dining room orders from the same station, or a banquet overlaps with restaurant service.
High-demand hospitality venues need capacity plans built for these pressure points rather than simple daily averages.
Advanced Kitchen Capacity Planning combines equipment limits, labor skills, preparation capacity, menu demand, and service timing into one operating model.
The objective is not creating the largest possible kitchen-it is making existing resources work together smoothly when demand becomes difficult.
Understand Practical Capacity Versus Theoretical Capacity
Every piece of kitchen equipment has theoretical capacity.
An oven might physically hold forty portions. A fryer might accommodate several baskets. A prep kitchen may have six workstations.
But theoretical capacity is rarely the number operators should use.
Employees need loading and unloading time. Products cook at different speeds. Equipment requires cleaning. Modified orders interrupt standard production.
This creates practical capacity—the output teams can repeatedly achieve while meeting food quality and safety standards.
Imagine an oven can technically contain 50 portions.
During real service, staff can consistently produce only 40 portions every cycle because items require spacing, rotation, and different finishing times.
Planning around 50 creates delays before dinner even begins.
Cornell restaurant revenue-management research notes that restaurant capacity can be limited by kitchen size, staffing, menu items, and other operational factors-not seating alone.
That makes realistic capacity measurement essential.
Map the Kitchen as a Network of Constraints
A kitchen is not one production unit.
It is a network.
Raw products move through storage, preparation, cooking stations, finishing areas, expo, and eventually service.
The overall system generally moves only as quickly as its most constrained stage.
Imagine the sauté station can produce 70 dishes per hour and the grill 60.
Expo, however, can coordinate only 50 finished plates per hour.
Increasing grill capacity to 80 does not solve the problem.
Expo remains the limiting factor.
Managers should therefore map each major stage using three questions:
What is the sustainable output?
When does a queue normally appear?
What happens upstream and downstream when this area slows?
A simple service observation can reveal surprisingly expensive bottlenecks.
Sometimes an extra shelf, better mise en place, or clearer communication improves capacity more than additional cooking equipment.
Forecast Item Mix, Not Just Revenue
Revenue forecasting is useful, but kitchens do not cook dollars.
They cook products.
A $20,000 dinner can create very different workloads depending on what customers order.
One evening may contain high beverage sales and easy-to-produce entrées. Another may generate the same revenue while hundreds of guests order labor-intensive dishes.
Forecasting should therefore include menu mix.
Historical POS data can estimate what percentage of customers normally order steak, pasta, seafood, salads, desserts, and other categories during particular dayparts.
Restaurant365 highlights the importance of combining menu-item popularity with profitability when analyzing product performance.
Capacity planners can use that popularity data operationally.
Suppose 300 dinner covers are expected and historically 25% select grilled proteins.
That implies approximately 75 grill entrées before adjustments for seasonality or special events.
If grill capacity is only 60 during the relevant ordering window, managers know about the mismatch before doors open.
That is far more useful than simply knowing expected sales.
Connect Prep Capacity With Service Capacity
Many peak-service failures actually begin several hours earlier.
The line may have enough cooking capacity, but prep was incomplete.
Perhaps vegetables were not portioned, sauces were behind schedule, garnishes were missing, or proteins were still being prepared when dinner started.
Capacity planning should therefore distinguish between prep capacity and service capacity.
Suppose a kitchen needs 400 portions ready for Friday night.
If the prep team can process only 70 portions per hour and has five effective hours available, theoretical output is 350.
The shortage is predictable.
Managers can solve it by adjusting shift start times, preparing appropriate components earlier, cross-training employees, simplifying production, or purchasing selected pre-prepared ingredients where quality standards allow.
Restaurant365’s kitchen-operations guidance connects forecasting with labor, inventory, recipes, and purchasing, showing why production planning needs to begin before actual service.
Good dinner execution often starts with better morning planning.
Schedule Skills, Not Just People
Ten cooks do not automatically equal ten units of interchangeable kitchen capacity.
Skills matter.
A highly experienced grill cook, pastry chef, banquet cook, and new prep employee contribute different types of capacity.
This becomes especially important when demand concentrates at one station.
Labor scheduling systems increasingly connect historical demand with expected staffing requirements. 7shifts, for example, uses projected sales and historical scheduling information to provide hourly labor recommendations.
High-demand venues should take the concept further by building a skill matrix.
Identify which employees can confidently work grill, sauté, fry, cold station, pizza, expo, banquet production, or multiple areas.
Cross-trained employees create what might be called flex capacity.
When demand shifts unexpectedly, management can move support where the queue is growing.
This flexibility can be more valuable than simply adding total headcount.
Labor deserves careful planning because National Restaurant Association data showed payroll and benefits represented a median 36.5% of full-service restaurant sales in 2024.
The goal is better deployment, not simply more labor.
Reduce Peak Complexity Without Reducing Quality
A kitchen may have adequate capacity under normal menu demand but struggle when too many complicated orders arrive simultaneously.
This is where menu complexity becomes a planning variable.
Consider a dish requiring:
- one grilled protein;
- one sautéed side;
- a separate sauce;
- two garnishes;
- final oven finishing.
That single entrée touches multiple stations.
When ordered fifty times during a peak hour, the operational burden spreads throughout the kitchen.
Operators can reduce complexity without making the dish feel cheaper.
A sauce may be prepared earlier. Two garnishes can become one stronger garnish. Certain components can be standardized while retaining final customization.
The National Restaurant Association reported that streamlined menus helped restaurants manage elevated food costs during 2024. Similar simplification can also support production capacity by reducing SKU counts, prep steps, and station interactions.
The objective is not eliminating culinary creativity.
It is removing complexity that customers barely notice while preserving the elements they genuinely value.
A simpler backstage process often produces better consistancy on the plate.
Build Different Capacity Plans for Different Demand Scenarios
One capacity plan cannot cover every operating situation.
A hotel restaurant may need plans for:
Normal weekday, peak weekend, large group, conference period, holiday, and special event.
Each scenario changes menu mix, staffing requirements, preparation volumes, and equipment pressure.
Forecasting platforms increasingly account for short-, medium-, and long-term demand trends rather than relying on a single historical average.
7shifts, for example, describes using recent patterns, seasonal trends, and year-over-year information within its forecasting approach.
Operators can create similar scenario logic manually.
Suppose normal dinner demand is 250 covers while major-event demand reaches 450.
Management should know in advance which operational changes activate above perhaps 325 covers.
An additional prep shift might begin. A second expo position may open. Certain complicated specials may be temporarily unavailable. Banquet production may move earlier.
These trigger points prevent managers from reinventing the operating plan during every busy shift.
Monitor Queue Length, Not Only Ticket Time
Average ticket time is useful, but it is often a lagging metric.
By the time average ticket time rises dramatically, the kitchen may already be buried.
Queue depth provides earlier warning.
If the grill normally maintains six open items and suddenly has 25, pressure is building even before delayed dishes reach the guest.
Kitchen display systems can help visualize real-time order flow. Toast states that orders can move directly from POS to kitchen displays, supporting organization and communication during service.
Managers should watch both the number and age of open tickets.
A growing queue suggests demand is arriving faster than the station can process it.
The response might involve sending assistance, adjusting firing sequences, communicating realistic expectations to front of house, or temporarily pacing new orders.
This creates proactive rather than reactive capacity management.
The strongest teams do not simply ask why ticket times were bad after dinner.
They recognize the warning signs while service is still recoverable.
Advanced Kitchen Capacity Planning is about matching real demand with the practical limits of equipment, employees, preparation, and menu complexity.
Measure station output, forecast item mix, map skill coverage, build scenario plans, and monitor queues before delays become severe.
Choose one high-demand service and calculate its biggest production constraint. Improving that single bottleneck may create more usable capacity than adding expensive equipment across the whole kitchen.